
Introduction
This original research was conducted for DREDF by Steve Kaye in September 2021, and is intended to show how age, disability, and race/ethnicity affect household access to the internet and household use of internet telehealth. The research was updated in September 2023, and is captured in two sets of five charts. The charts give the percentage of household residents’ access to the internet by age group, age and disability, age and race/ethnicity, race/ethnicity and disability, and all three in combination.
The underlying data source is the Community Living Policy Center’s analysis of November 2021 data from the Current Population Survey on U.S. household residents.
Home Internet Usage

Slide 1: This bar chart examines the percentage of household residents in the United States that do not have access to the Internet at home, according to age group. There are four categories of resident age groups as follows: those between 18 and 44 years, those between 45 and 64 years, those between 65 and 74 years, and those over 75 years. The first blue colored band in the chart shows that 18.2% of household residents between 18 and 44 years lack internet access at home. The next band shows that 21.6% of household residents between 45 and 64 years lack internet access at home. The third band shows that 24.6% of residents between 65 and 74 years lack internet access at home. The fourth band shows that 39.5% of residents over 75 years old lack internet access at home.

Slide 2: This bar chart examines the percentage of household residents in the United States that lack access to the Internet at home, according to age group and disability status. There are four categories of resident ages in which persons with and without disabilities are compared: those between 18 and 44 years, those between 45 and 64 years, those between 65 and 74 years, and those over 75 years. For those between 18 and 44 years, 21% of household residents with disabilities lack internet access at home, while 18% of household residents without disabilities lack access. For those between 45 and 64 years, 29% of household residents with disabilities lack internet access at home, while 21% of residents without disabilities lack access. For household residents between 65 and 74 years, 30% of residents with disabilities lack internet access at home, while 23% of residents without disabilities lack access. The gap further widens for those over 75 years, where 49% of household residents in this age group with disabilities lack internet access at home, while 33% of residents without disabilities lack access.

Slide 3: This bar chart examines the percent of household residents in the United States that lack access to the Internet at home, according to age group and race/ethnicity. In general, across all age ranges, Latine residents have the least access to the internet at home, followed by Black non-Latine residents, Native non-Latine residents, Asian non-Latine residents, and then White non-Latine residents. The specific percentage breakdown of access for household residents in each age group are below, in order of increasing age.
- For those between 18 and 44 years, 23% of Latine household residents lack internet access at home, 20% of both Black non-Latine residents and Native non-Latine residents lack access, 17% of Asian non-Latine residents lack access, and 16% of White non-Latine residents lack access. The bars on the graph illustrate that the percentage of Black non-Latine residents that lack access is slightly greater than the number of Native non-Latine residents lacking access;
- For those between 45 and 64 years, 28% of both Latine residents and Black non-Latine residents lack internet access at home, 27% of Native non-Latine lack access, and 19% of both Asian non-Latine and White non-Latine residents lack access;
- For those between 65 and 74 years, 42% of Latine residents lack internet access at home, 36% of Black non-Latine residents lack access, 30% of Native non-Latine residents lack access, 32% of Asian non-Latine residents lack access, and 20% of White non-Latine residents lack access; and
- For those over 75 years, 54% of Latine residents lack internet access at home, 51% of both Black non-Latine residents and Native non-Latine residents lack access, 47% of Asian non-Latine residents lack access, and 36% of White non-Latine residents lack access. The bars on the graph illustrate that the percentage of Black non-Latine residents that lack access is slightly greater than the number of Native non-Latine residents lacking access
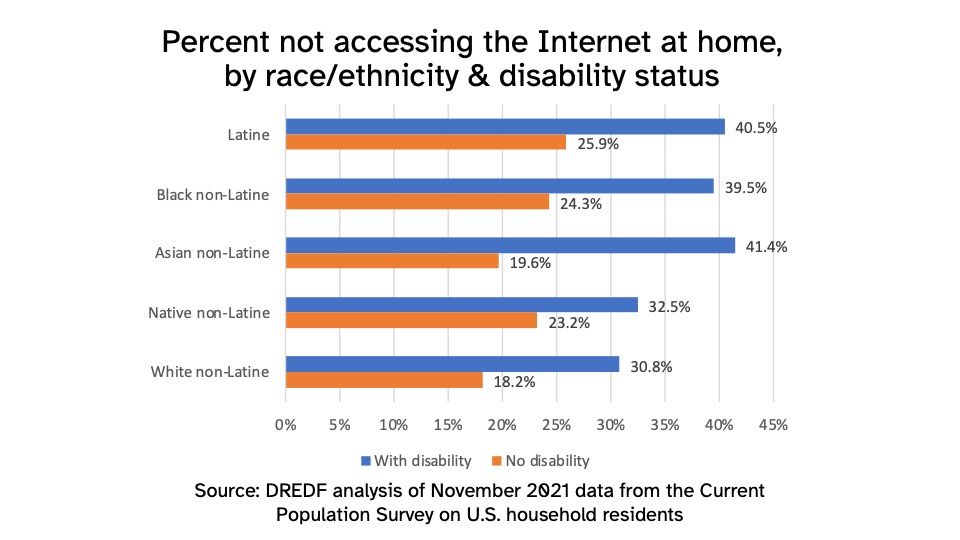
Slide 4: This bar chart examines the percentage of household residents in the United States that do not have access to the Internet at home, according to race/ethnicity and disability status. For Latine residents, 40.5% of Latine residents with disabilities lack internet access at home, while 25.9% of Latine residents without disabilities lack access. For Black non-Latine residents, 39.5% of Black non-Latine residents with disabilities lack internet access at home, while 24.3% of Black non-Latine residents without disabilities lack access. For Asian non-Latine residents, 41.4% of Asian-non Latine residents with disabilities lack internet access at home, while 19.6% of Asian non-Latine residents without disabilities lack access. For Native non-Latine residents, 32.5% of Native non-Latine residents with disabilities lack internet access at home, while 23.2% of Native non-Latine residents without disabilities lack access. For White non-Latine residents, 30.8% of White non-Latine residents with disabilities lack internet access at home, while 18.2% of White non-Latine residents without disabilities lack access.
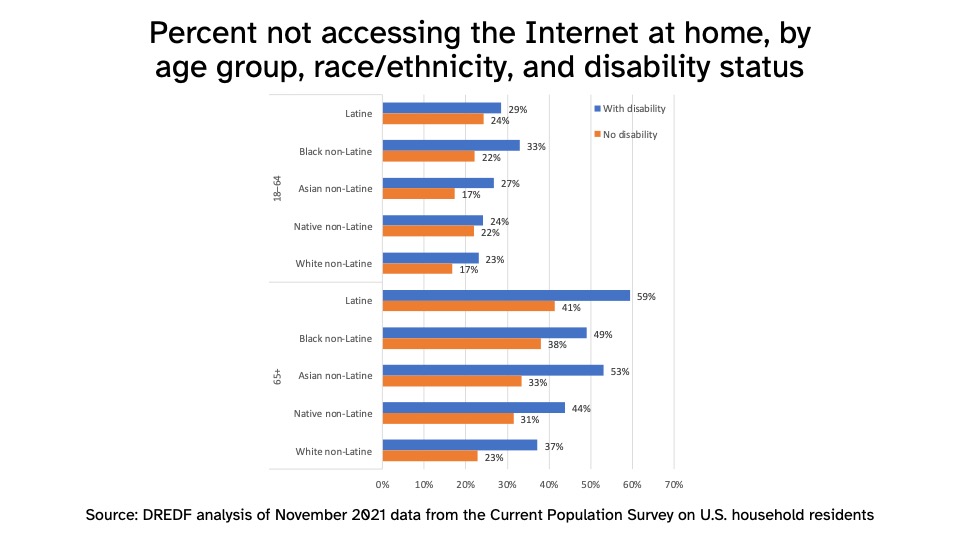
Slide 5: This bar chart examines the percentage of household residents in the United States that lack internet access at home, according to age group, race/ethnicity, and disability status. The graph is broken into two sub-graphs: (1) one analyzing the percentage of household residents in the United States without internet access at home between the ages of 18 and 64 years, according to race/ethnicity and disability status; and (2) one analyzing the percentage of household residents in the United States without internet access at home over 65 years, according to race/ethnicity and disability status. The percentage breakdown regarding the lack of access to the Internet at home for household residents between 18 and 64 years, according to race/ethnicity and disability status is below:
- For Latine residents between 18 and 64 years, 29% of Latine residents with disabilities lack internet access at home, while 24% of Latine residents without disabilities lack access;
- For Black non-Latine residents between 18 and 64 years, 33% of Black non-Latine residents with disabilities lack internet access at home, while 22% of Black non-Latine residents without disabilities lack access;
- For Asian non-Latine residents between 18 and 64 years, 27% of Asian non-Latine residents with disabilities lack internet access at home, while 17% of Asian non-Latine residents without disabilities lack access;
- For Native non-Latine residents between 18 and 64 years, 24% of Native non-Latine residents with disabilities lack internet access at home, while 22% of Native non-Latine residents without disabilities lack access; and
- For White non-Latine residents between 18 and 64 years, 23% of White non-Latine residents with disabilities lack internet access at home, while 17% of White non-Latine residents without disabilities lack access
The percentage breakdown regarding the lack of access to the Internet at home for household residents over 65 years, according to race/ethnicity and disability status is below:
- For Latine residents over 65 years, 59% of Latine residents with disabilities lack internet access at home, while 41% of Latine residents without disabilities lack access;
- For Black non-Latine residents over 65 years, 49% of Black non-Latine residents with disabilities lack internet access at home, while 38% of Black non-Latine residents without disabilities lack access;
- For Asian non-Latine residents over 65 years, 53% of Asian non-Latine residents with disabilities lack home internet access, while 33% of Asian non-Latine residents lack access;
- For Native non-Latine residents over 65 years, 44% of Native non-Latine residents with disabilities lack internet access at home, while 31% of Native non-Latine residents without disabilities lack access;
- For White non-Latine residents over 65 years, 37% of White non-Latine residents with disabilities lack internet access at home, while 23% of White non-Latine residents without disabilities lack access
Telehealth Usage

Slide 1: This bar chart examines the percentage of household residents in the United States using Internet telehealth, according to age group. There are four categories of resident age groups as follows: those between 18 and 44 years, those between 45 and 64 years, those between 65 and 74 years, and those over 75 years. For those between 18 and 44 years, 44.8% of household residents use Internet telehealth. For those between 45 and 64 years, 43.7% of household residents use Internet telehealth. The percentage continues to decrease with those between 65 and 74 years, where 42.5% of household residents in this age group use Internet telehealth. For those over 75 years, 30.9% of household residents use Internet telehealth.
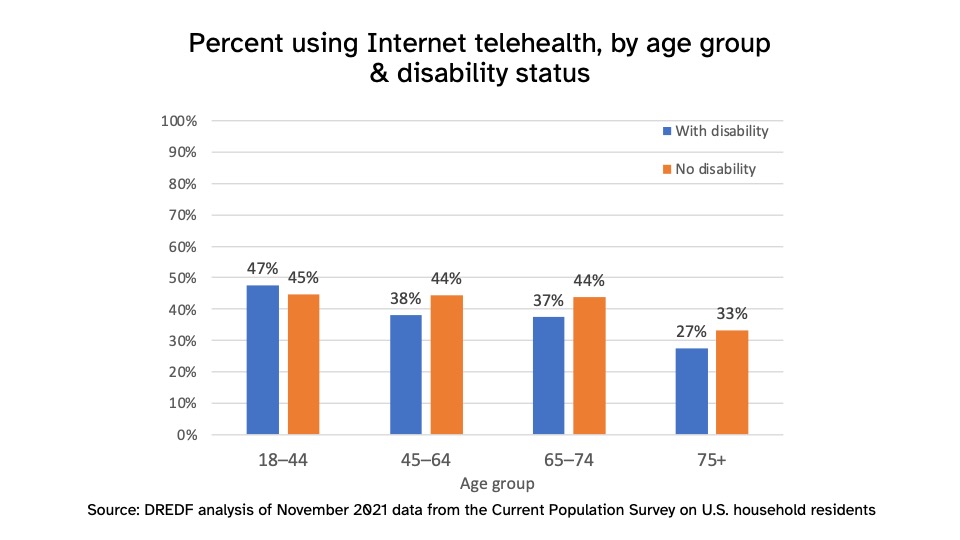
Slide 2: This bar chart examines the percentage of household residents in the United States that use Internet telehealth, according to disability status and age group. There are four categories of resident ages in which persons with and without disabilities are compared: those between 18 and 44 years, those between 45 and 64 years, those between 65 and 74 years, and those over 75 years. For those between 18 and 44 years, 47% of household residents with disabilities use Internet telehealth, while 45% of household residents without disabilities use it. For those between 45 and 64 years, 38% of household residents with disabilities use Internet telehealth, while 44% of those without disabilities use it. For household residents between 65 and 74 years, 37% of household residents with disabilities use Internet telehealth, while 44% household residents without disabilities use it. For those over 75 years, 27% of household residents with disabilities use Internet telehealth, while 33% of residents without disabilities use it.
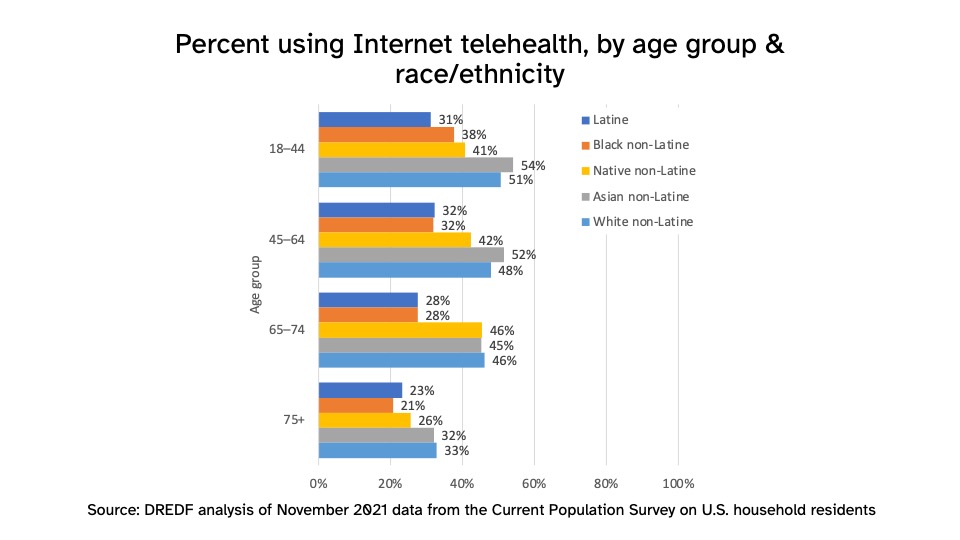
Slide 3: This bar chart examines the percentage of household residents in the United States that use Internet telehealth according to race/ethnicity and age. The bar chart is broken into four sub-graphs that analyze the percentage of Internet telehealth by race/ethnicity within four different age groups: those between 18 and 44 years, those between 45 and 64 years, those between 65 and 74 years, and those over 75 years. The specific percentage breakdown of access for household residents in each age group are below, in order of increasing age.
- For those between 18 and 44 years, 31% of Latine household residents use Internet telehealth, 38% of Black non-Latine residents use Internet telehealth, 41% of Native non-Latine residents use Internet telehealth, 54% of Asian non-Latine residents use Internet telehealth, and 51% of White non-Latine residents use Internet telehealth;
- For those between 45 and 64 years, 32% of both Latine residents and Black non-Latine residents use Internet telehealth, 42% of Native non-Latine residents use Internet telehealth, 52% Asian non-Latine residents use Internet telehealth, and 48% of White non-Latine residents use Internet telehealth. The bars on the graph illustrate that the percentage of Latine residents using Internet telehealth is slightly greater than the number of Black non-Latine residents using it;
- For those between 65 and 74 years, 28% of both Latine residents and Black non-Latine residents use Internet telehealth, 45% of Asian non-Latine residents use Internet telehealth, and 46% of both Native non-Latine residents and White non-Latine residents use Internet telehealth. The bars on the graph illustrate that the percentage of White non-Latine residents using Internet telehealth is slightly greater than the number of Native non-Latine residents using it; and
- For those over 75 years, 23% of Latine residents use telehealth, 21% of Black non-Latine residents use Internet telehealth, 26% of Native non-Latine residents use Internet telehealth, 32% of Asian non-Latine residents use Internet telehealth, and 33% of White non-Latine residents use Internet telehealth.
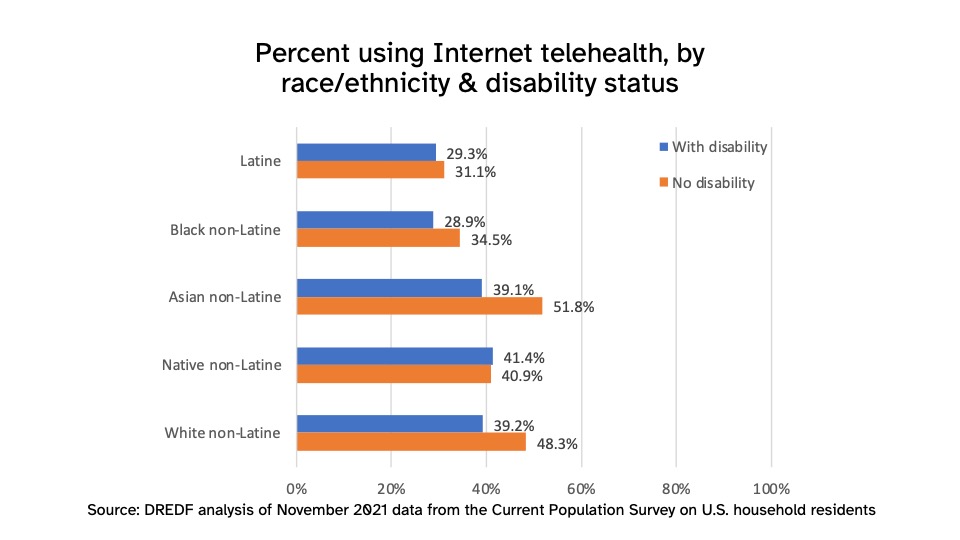
Slide 4: This chart examines the percentage of household residents in the United States that use Internet telehealth, according to race/ethnicity and disability status. For Latine residents, 29.3% of Latine residents with disabilities use Internet telehealth, while 31.1% of Latine residents without disabilities use it. For Black non-Latine residents, 28.9% of Black non-Latine residents with disabilities use Internet telehealth, while 34.5% of Black non-Latine residents without disabilities use it. For Asian non-Latine residents, 39.1% of Asian-non Latine residents with disabilities use Internet telehealth, while 51.8% of Asian non-Latine residents without disabilities use it. For Native non-Latine residents, 41.4% of Native non-Latine residents with disabilities use Internet telehealth, while 40.9% of Native non-Latine residents without disabilities use it. For White non-Latine residents, 39.2% of White non-Latine residents with disabilities use Internet telehealth, while 48.3% of White non-Latine residents without disabilities use it.

Slide 5: This chart examines the percentage of household residents in the United States that use Internet telehealth according to age group, race/ethnicity, and disability status. The chart is broken into two sub-graphs: (1) one analyzing the percent of household residents in the United States using Internet telehealth between the ages of 18 and 64 years, according to race/ethnicity and disability status; and (2) one analyzing the percent of household residents in the United States using Internet telehealth over 65 years, according to race/ethnicity and disability status. The percentage breakdown regarding use of Internet telehealth for household residents between 18 and 64 years, according to race/ethnicity and disability status is below:
- For Latine residents between 18 and 64 years, 33% of Latine residents with disabilities use Internet telehealth, while 32% of Latine residents without disabilities use it;
- For Black non-Latine residents between 18 and 64 years, 33% of Black non-Latine residents with disabilities use Internet telehealth, while 36% of Black non-Latine residents without disabilities use it;
- For Asian non-Latine residents between 18 and 64 years, 46% of Asian non-Latine residents with disabilities use Internet telehealth, while 53% of Asian non-Latine residents without disabilities use it;
- For Native non-Latine residents between 18 and 64 years, 45% of Native non-Latine residents with disabilities use Internet telehealth, while 41% of Native non-Latine residents without disabilities use it; and
- For White non-Latine residents between 18 and 64 years, 46% of White non-Latine residents with disabilities use Internet telehealth, while 50% of White non-Latine residents without disabilities use it.
The percentage breakdown regarding use of Internet telehealth for household residents over 65 years, according to race/ethnicity and disability status is below:
- For Latine residents over 65 years, 23% of Latine residents with disabilities use Internet telehealth, while 27% of Latine residents without disabilities use it;
- For Black non-Latine residents over 65 years, 23% of Black non-Latine residents with disabilities use Internet telehealth, while 26% of Black non-Latine residents without disabilities use it;
- For Asian non-Latine residents over 65 years, 34% of Asian non-Latine residents with disabilities use Internet telehealth, while 42% of Asian non-Latine residents use it;
- For Native non-Latine residents over 65 years, 37% of Native non-Latine residents with disabilities use Internet telehealth, while 41% of Native non-Latine residents without disabilities use it;
- For White non-Latine residents over 65 years, 34% of White non-Latine residents with disabilities use Internet telehealth, while 43% of White non-Latine residents without disabilities use it.